Data pipeline with Docker, InfluxDB, and Grafana
Set up a typical data pipeline as may be used in experimental science and IOT, with Docker, InfluxDB, and Grafana.
Introduction
In this beginner's guide, you will learn how to set up a typical data pipeline as may be used in experimental science and IOT (Internet of things), with modern tools: Docker, InfluxDB, and Grafana.
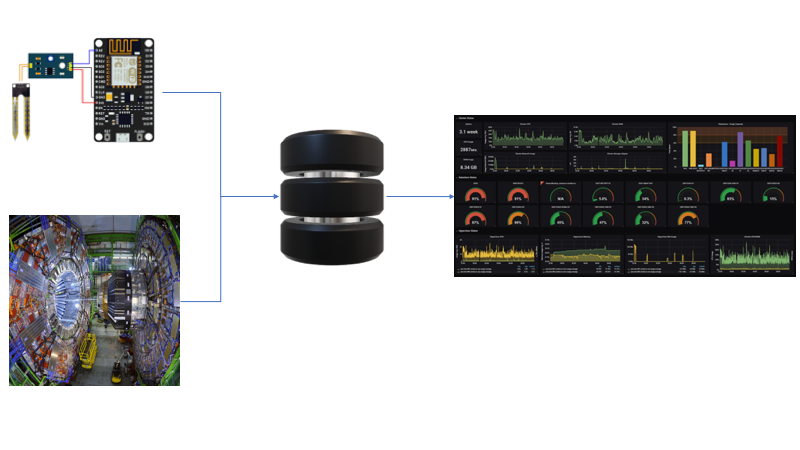
A data pipeline may consist of three stages:
- the data is collected by a sensor as a function of time
- it is stored in a database
- a dashboard accesses the database to visualize the data.
Setting up such a pipeline might require the installation and maintenance of a lot of software, including their dependencies.
This can take hours and even days, and must be redone for each platform, e.g. Linux, MacOS, Windows. And it could even be impossible to setup the pipeline on a given platform...
Docker makes it easy for developers to set up a cross-platform stack of services, and easy for users to install and run the stack on a wide variety of hardware and operating systems.
Our stack will consist of:
- a python dummy sensor : generates points as a function of time, and write them to the database.
- an InfluxDB server : manages the database
- a Grafana server : dashboard for data visualization
We'll set up everything from scratch, so that you are able to adapt this kind of pipeline to your use case!
When you're done, you will know how to do the following:
-
Docker:
- create your own images
- build a stack of services
- create multi-architecture images
-
InfluxDB:
- insert and select data from the command line interface and from python
-
Grafana:
- set up and configure a dashboard
This guide is for the X86_64 architecture (PCs and macs), and has been tested on Linux and MacOS. So if you're a Linux or mac user, it will work for you.
However, at the end, we will port our stack to the armv7l architecture (e.g. raspberry pi 3B+).
So let's get started!
Docker

If you’ve never used docker, please follow the first two sections of the excellent guide Getting Started with Docker , where you will
- understand the basic Docker concepts,
- install Docker. If you're using Linux, make sure to follow the Linux post-install instructions as well to be able to run docker without sudo.
- use simple existing docker images,
- learn how to build your own image, and how to distribute it on Docker Hub
I'm going to assume you're done with this. In case of issues, feel free to ask questions in the comments below and I'll help you.
Let me explain what we're going to do in more details.
A Docker stack is a group of interrelated services that share dependencies. In our stack, we will set up three services:
- the dummy sensor,
- the InfluxDB server,
- the Grafana visualisation tool.
For InfluxDB and Grafana, we will simply use existing images. For the dummy sensor, we will have to write the code ourselves and to create our own image. Finally, we will put everything together in the stack.
InfluxDB
InfluxDB is a time-series database designed to handle high write and query loads. So it's perfectly adapted to our use case, which is to store data collected by a sensor as a function of time.
You might be starting to get scared at the idea of installing and managing a database server... Don't be. Docker is here to help us and you'll get your database up and running in a few minutes.
Running InfluxDB in Docker
We're going to use the official influxdb image . Pull this image, and list the images locally installed on your computer:
docker pull influxdb
docker image ls
You should get:
REPOSITORY          TAG                 IMAGE ID            CREATED             SIZE
influxdb            latest              d5fbcd433ed8        2 weeks ago         258MB
Now create a container from this image and run it:
docker run -d -p 8086:8086 -v influxdb:/var/lib/influxdb --name influxdb influxdb
Here are the options we used:
- -d : run in detached mode. This means that the container starts in the background, so that you can keep using your command line on the host.
- -p : forwards port 8086 of the host to port 8086 of the container. That’s the port that is used to interact with the InfluxDB server. This means that you will just need to contact localhost:8086 from the host to create and query your database.
- -v : creates a docker volume called influxdb, corresponding to /var/lib/influxdb in the container, which is where the influxdb data is going to be stored. Without this volume, every time the container stops, the data would disappear, and we would have to redefine and fill our database again. But since volumes survive when containers are stopped, they are a way to make the database information persistent.
- --name : give a name that's easy to remember to the container (we chose influxdb)
The server is now running, and we will use the InfluxDB command line interface (CLI) to create a test database, and to try inserting and selecting data.
The InfluxDB Command Line Interface
The InfluxDB CLI is called influx, and we can run it like this:
docker exec -it influxdb influx
The docker exec command is used to execute a command in a running container. Here, we open an interactive terminal (-it option) in the influxdb container (that’s the name we have chosen above), running influx. Once in the CLI:
Create a test database
> create database testdb
> show databases
name: databases
name
----
_internal
testdb
> use testdb
Using database testdb
We have just created a new database, and we are now using it.
Insert a measurement:
> insert sensor1 x=1,y=2
And retrieve all entries from the database:
> select * from sensor1
name: sensor1
time                x y
----                - -
1567156729790701428 1 2
Two things to note:
- sensor1 is a measurement. That's the equivalent of a table in a relational database
- the timestamp is automatically added by influxdb, and this timestamp is used to index the table.
Now quit influx:
exit
Note that the container is still running:
> docker container ls
CONTAINER ID        IMAGE               COMMAND                  CREATED             STATUS              PORTS                    NAMES
3fb08a69adc7        influxdb            "/entrypoint.sh infl…"   7 minutes ago       Up 7 minutes        0.0.0.0:8086->8086/tcp   influxdb
You can stop and restart it by doing:
docker container stop influxdb
docker container start influxdb
If you do so, and even if you remove the container completely, you will see that the influxdb volume is still there:
> docker volume ls
DRIVER              VOLUME NAME
local               1f70389751653791f3b85e56fa35e5ec45a03d513d357c93507e97db58d3d561
local               influxdb
So your data is preserved when the container is stopped and removed.
The InfluxDB HTTP API
You can query the database remotely with HTTP. Remember that http://localhost:8086 points to port 8086 in the container, and thus to the InfluxDB server.
We can insert a second sensor1 point:
curl -i -XPOST 'http://localhost:8086/write?db=testdb' --data-binary 'sensor1 x=2,y=3,z=4'
and then select all entries in sensor1:
> curl -G http://localhost:8086/query?db=testdb --data-urlencode "q=select * from sensor1”

{"results":[{"statement_id":0,"series":[{"name":"sensor1","columns":["time","x","y","z"],"values":[["2019-08-30T09:18:49.790701428Z",1,2,null],["2019-08-30T09:31:03.547017156Z",2,3,4]]}]}]}
We see that the two entries are there. Please note that we decided to add a new field in the second measurement. InfluxDB gracefully handles this, and sets the new field to null for the records that didn’t have it. That’s one of the big advantages of InfluxDB: no need to define a database schema in advance.
We'll see later how to write to influxdb from python, when we set up our dummy sensor. For now, let's set up the Grafana dashboard.
Grafana
Grafana is the leading open source software for time-series analytics. It can connect to a wide variety of data sources, including InfluxDB of course. Moreover, its graphical user interface makes it very easy to set up a dashboard to present your data is the way you like.
So again, it seems that this tool is perfectly adapted to our use case, and we will use the official grafana image:
docker pull grafana/grafana
docker run -p 3000:3000 -v grafana:/var/lib/grafana grafana/grafana
Port 3000 on the local host is redirected to port 3000 in the grafana container. That's the one we'll use to connect to the grafana server with our web browser.
We needed to define a volume so our grafana preferences and dashboards are kept when the grafana container is stopped or removed.
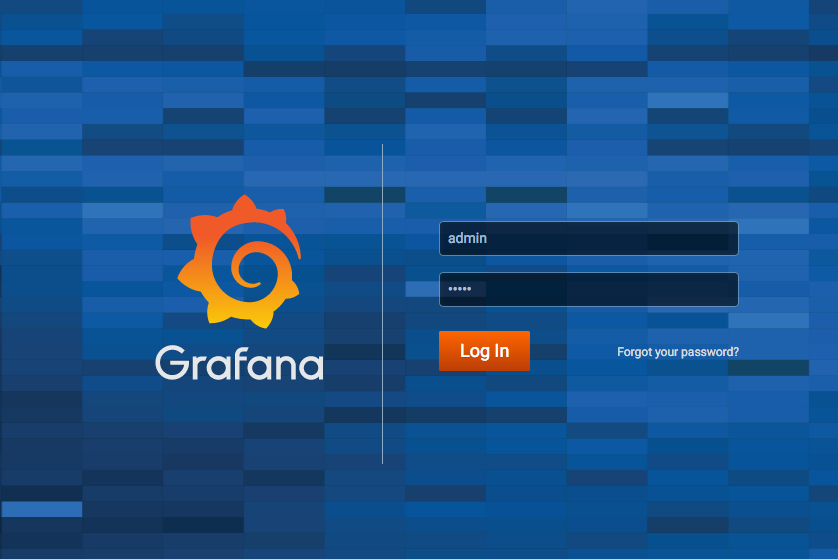
Log in to grafana by pointing your web browser to http://localhost:3000 . Use the default user and password: admin / admin, and feel free to change the password.
The dummy sensor: Write to InfluxDB from python
Hello world with Docker and python
Before writing the actual python code for the dummy sensor, let's start with running a simple "Hello world" python script in a Docker container.
Go to an empty directory, and create the python script app.py:
#app.py
import sys
print('Hello world! this is ' + sys.argv[1])
And test it with:
python app.py me
Then, create the Dockerfile:
# Dockerfile
# Use an official Python runtime as a parent image
FROM python:3.6.9-slim

# Set the working directory to /app
# in the container
WORKDIR /app

# Copy the python script
COPY app.py /app/app.py

# Run app.py when the container launches
# The -u flag specifies to use the unbuffered ouput.
# in this way, what's printed by the app is visible on the host
# while the container is running
CMD ["python", "-u", "app.py", "me"]
You're now ready to build and run your image:
docker build -t hello .
docker run hello
You get:
Hello world! this is me
Great, we can run python in a docker container. Please note that the hello world script was executed by the version of python installed in the container, which is python 3.6.9, and we can check it:
docker run hello python --version
Python 3.6.9
This command runs the same container but overrides the command specified at the end of the Dockerfile.
That was an important first step.
Now, our dummy sensor will need to connect to the InfluxDB server using an InfluxDB client. Such a client is available in the influxdb python package, which is not installed by default.
Install a python package in a Docker container
To install influx for the python executable that runs in the container, we'll use pip. Modify your Dockerfile to:
# Dockerfile
# Use an official Python runtime as a parent image
FROM python:3.6.9-slim

# Set the working directory to /app
# in the container
WORKDIR /app

# Install any needed packages specified in requirements.txt
COPY requirements.txt /app/requirements.txt
RUN pip install --trusted-host pypi.python.org -r requirements.txt

# Copy the python script
COPY app.py /app/app.py

# Run app.py when the container launches
# The -u flag specifies to use the unbuffered ouput.
# in this way, what's printed by the app is visible on the host
# while the container is running
CMD ["python", "-u", "app.py", "me"]
Create requirements.txt. This file should only contain the following (but you could add any package you need):
# requirements.txt
influxdb
Build again:
docker build -t python_influx .
To check that influxdb was correctly installed in the image, we start a container from the python_influx image, and we try to import the module in python:
docker run python_influx python -c 'import influxdb'
This command should print nothing if influxdb is installed, and otherwise print an exception.
If all is fine, we can start writing python code for our dummy sensor.
The dummy sensor
We will need to write to our influxdb server, so first make sure that it is running under the name influxdb (last column):
docker container ls

CONTAINER ID        IMAGE               COMMAND                  CREATED             STATUS              PORTS                    NAMES
30b6d4266eed        influxdb            "/entrypoint.sh infl…"   45 hours ago        Up 45 hours         0.0.0.0:8086->8086/tcp   influxdb
If not, run it:
docker run -d -p 8086:8086 -v influxdb:/var/lib/influxdb --name influxdb influxdb
Here is the code for the dummy sensor:
app.py :
from influxdb import InfluxDBClient
import requests

import time
import datetime
import math
import pprint
import os
import signal
import sys

client = None
dbname = 'mydb'
measurement = 'sinwave'


def db_exists():
    '''returns True if the database exists'''
    dbs = client.get_list_database()
    for db in dbs:
        if db['name'] == dbname:
            return True
    return False

def wait_for_server(host, port, nretries=5):
    '''wait for the server to come online for waiting_time, nretries times.'''
    url = 'http://{}:{}'.format(host, port)
    waiting_time = 1
    for i in range(nretries):
        try:
            requests.get(url)
            return
        except requests.exceptions.ConnectionError:
            print('waiting for', url)
            time.sleep(waiting_time)
            waiting_time *= 2
            pass
    print('cannot connect to', url)
    sys.exit(1)

def connect_db(host, port, reset):
    '''connect to the database, and create it if it does not exist'''
    global client
    print('connecting to database: {}:{}'.format(host,port))
    client = InfluxDBClient(host, port, retries=5, timeout=1)
    wait_for_server(host, port)
    create = False
    if not db_exists():
        create = True
        print('creating database...')
        client.create_database(dbname)
    else:
        print('database already exists')
    client.switch_database(dbname)
    if not create and reset:
        client.delete_series(measurement=measurement)


def measure(nmeas):
    '''insert dummy measurements to the db.
    nmeas = 0 means : insert measurements forever.
    '''
    i = 0
    if nmeas==0:
        nmeas = sys.maxsize
    for i in range(nmeas):
        x = i/10.
        y = math.sin(x)
        data = [{
            'measurement':measurement,
            'time':datetime.datetime.now(),
            'tags': {
                'x' : x
                },
                'fields' : {
                    'y' : y
                    },
            }]
        client.write_points(data)
        pprint.pprint(data)
        time.sleep(1)

def get_entries():
    '''returns all entries in the database.'''
    results = client.query('select * from {}'.format(measurement))
    # we decide not to use the x tag
    return list(results[(measurement, None)])


if __name__ == '__main__':
    import sys

    from optparse import OptionParser
    parser = OptionParser('%prog [OPTIONS] <host> <port>')
    parser.add_option(
        '-r', '--reset', dest='reset',
        help='reset database',
        default=False,
        action='store_true'
        )
    parser.add_option(
        '-n', '--nmeasurements', dest='nmeasurements',
        type='int',
        help='reset database',
        default=0
        )

    options, args = parser.parse_args()
    if len(args)!=2:
        parser.print_usage()
        print('please specify two arguments')
        sys.exit(1)
    host, port = args
    connect_db(host, port, options.reset)
    def signal_handler(sig, frame):
        print()
        print('stopping')
        pprint.pprint(get_entries())
        sys.exit(0)
    signal.signal(signal.SIGINT, signal_handler)

    measure(options.nmeasurements)

    pprint.pprint(get_entries())
Our goal here is to set up the complete data pipeline, so I'm not going to explain this script in details. But if you have any question about this script, just tell me in the comments below and I'll be happy to help.
Save this script as app.py, in place of the "Hello World" script, and build the image. We can
docker build . -t sensor
docker run sensor python app.py
Usage: app.py [OPTIONS] <host> <port>

please specify two arguments
So the script is running, but it exits immediately as it requires two arguments: the hostname and the port of the InfluxDB server. Let's provide them:
docker run sensor python -u app.py localhost 8086
connecting to database: localhost:8086
waiting for http://localhost:8086
waiting for http://localhost:8086
waiting for http://localhost:8086
waiting for http://localhost:8086
waiting for http://localhost:8086
cannot connect to http://localhost:8086
Hmm the script cannot find the InfluxDB server. Remember that the sensor script is running in a container based on the sensor image. So in this container, localhost points to the container itself. Since this container does not run the InfluxDB server, it's no surprise that the script cannot find it.
The InfluxDB server is running in our influxdb container. So let's try something else:
docker run sensor python -u app.py influxdb 8086
connecting to database: influxdb:8086
waiting for http://influxdb:8086
waiting for http://influxdb:8086
waiting for http://influxdb:8086
waiting for http://influxdb:8086
waiting for http://influxdb:8086
cannot connect to http://influxdb:8086
This still does not work... It's actually due to the fact that Docker container can see each other only if they share the same network.
So let's create a network:
docker network create mynet
Add the influxdb container to this network:
docker network connect mynet influxdb
And run the sensor container on the same network:
docker run --network mynet sensor python -u app.py influxdb 8086
And now it works, as shown below. You can stop producing measurements by hitting ctrl-C, and then the measurements written to the database so far are printed:
connecting to database: influxdb:8086
creating database...
[{'fields': {'y': 0.0},
  'measurement': 'sinwave',
  'tags': {'x': 0.0},
  'time': datetime.datetime(2019, 9, 4, 13, 21, 52, 730937)}]
[{'fields': {'y': 0.09983341664682815},
  'measurement': 'sinwave',
  'tags': {'x': 0.1},
  'time': datetime.datetime(2019, 9, 4, 13, 21, 53, 790511)}]
[{'fields': {'y': 0.19866933079506122},
  'measurement': 'sinwave',
  'tags': {'x': 0.2},
  'time': datetime.datetime(2019, 9, 4, 13, 21, 54, 805796)}]
^C
stopping
[{'time': '2019-09-04T13:21:52.730937088Z', 'x': '0.0', 'y': 0},
 {'time': '2019-09-04T13:21:53.790510848Z',
  'x': '0.1',
  'y': 0.09983341664682815},
 {'time': '2019-09-04T13:21:54.80579584Z',
  'x': '0.2',
  'y': 0.19866933079506122}]
Packaging the dummy sensor image
So far, we have used the Dockerfile we created above for the python + InfluxDB example, and we have overridden the CMD of this Dockerfile. We need to edit the Dockerfile to provide the correct arguments for the dummy sensor script:
# Use an official Python runtime as a parent image
FROM python:3.6.9-slim

# Set the working directory to /app
WORKDIR /app

# Install any needed packages specified in requirements.txt
COPY requirements.txt /app/requirements.txt
RUN pip install --trusted-host pypi.python.org -r requirements.txt

# Copy the current directory contents into the container at /app
COPY app.py /app/app.py

# Run app.py when the container launches
# The -u flag specifies to use the unbuffered ouput.
# in this way, what's printed by the app is visible on the host
# while the container is running
CMD ["python", "-u", "app.py", "influxdb", "8086"]
Build the image again, and run it, this time without overriding the command:
docker build . -t sensor
docker run --network mynet sensor
Log in to https://hub.docker.com/ (create your account if you don’t already have it):
docker login
We will specify that our image is for the architecture we are currently using. So first, we need to find out about our architecture. Just do
uname -m
On macOS or a PC, you’re going to get X86_64. On a raspberry pi 3B+, armv7l (where the last character is an L). I suggest to use the architecture name as given by uname to tag the image. For example, I’m now working on a PC, and my architecture is X86_64. So I tag like this:
docker tag sensor cbernet/iot_dummy_sensor:v1.0-X86_64
In this string, you do need to specify your docker username if you are to push the image to docker hub later on. Then, the tag string contains the repository name (iot_dummy_sensor) and the tag name, v1.0-X86-64.
The repository and tag names are really up to you. As you can see, I decided to specify both a version and the architecture in the tag name.
Now we can list our images:
docker image ls
REPOSITORY                 TAG                 IMAGE ID            CREATED             SIZE
sensor                     latest              e07f25bec297        5 seconds ago       186MB
cbernet/iot_dummy_sensor   v1.0-X86_64         e07f25bec297        5 seconds ago       186MB
python                     3.6.9-slim          b1b91aef77d1        8 days ago          174MB
influxdb                   latest              d5fbcd433ed8        2 weeks ago         258MB
sensor:latest and cbernet/iot_dummy_sensor:v1.0-X86_64 have the same IMAGE ID, which means that they are identical.
Now push your image to Docker Hub:
docker push cbernet/iot_dummy_sensor:v1.0-X86_64
You can then go to your Docker Hub profile page, and see that your image has been properly uploaded. Now everybody with an X86_64 architecture will be able to pull it and use it directly to run the dummy sensor.

Compose the Docker stack
We now have all the elements we need to compose our stack:
- the official InfluxDB image
- the official Grafana image
- our custom dummy sensor image.
So let's build this stack at last!
First find and stop running containers with these commands:
docker container ls
docker container stop
Then clean up your docker environment (WARNING: this will remove everything, so do not do that if you're using Docker for something else - in which case you know what you're doing):
docker system prune -a --volumes
Install Docker compose . I decided to install it with pip (please read the instructions above carefully in case of issues with the command below):
pip install docker-compose
Write this docker-compose.yml file:
version: "3"
services:
  influxdb:
    image: influxdb
    ports:
      - "8086:8086"
    volumes:
      - influxdb:/var/lib/influxdb
  sensor:
# use your username instead of mine below!
    image: cbernet/iot_dummy_sensor:v1.0-X86_64
    links:
      - influxdb
  dashboard:
    image: grafana/grafana
    links:
      - sensor
    ports:
      - "3000:3000"
    volumes:
      - grafana:/var/lib/grafana

volumes:
  influxdb:
  grafana:
This should look pretty obvious to you at this point. We define how each container should be built:
- from which image
- which are the exposed ports
- which are the data volumes
We specify that the sensor container depends on the influxdb container. By default, all containers are put in the same network. Therefore, they will be able to see each other.
Then start the stack in detached mode:
docker-compose up -d
Check the running containers:
docker container ls

CONTAINER ID        IMAGE                      COMMAND                  CREATED             STATUS              PORTS                    NAMES
6024ecd0cdeb        grafana/grafana            "/run.sh"                14 seconds ago      Up 12 seconds       0.0.0.0:3000->3000/tcp   influxdb_dashboard_1
c72080c51143        cbernet/iot_dummy_sensor   "python -u app.py inâ¦"   15 seconds ago      Up 13 seconds                                influxdb_sensor_1
c8db0b70b9de        influxdb                   "/entrypoint.sh inflâ¦"   17 seconds ago      Up 14 seconds       0.0.0.0:8086->8086/tcp   influxdb_influxdb_1
Run influx in the influxdb container:
docker exec -it influxdb_influxdb_1 influx
Check that your database is getting filled (we select the last 10 entries, so repeat this command to see new entries):
> use mydb
> select * from sinwave order by time desc limit 10
name: sinwave
time                x    y
----                -    -
1567605401776061184 12.6 0.033623047221136695
1567605400765149184 12.5 -0.06632189735120068
1567605399750355968 12.4 -0.1656041754483094
1567605398735478016 12.3 -0.26323179136580094
1567605397720304896 12.2 -0.3582292822368287
1567605396705470976 12.1 -0.44964746453460147
1567605395690498048 12.0 -0.5365729180004349
1567605394675230976 11.9 -0.6181371122370333
1567605393657037056 11.8 -0.6935250847771224
1567605392641920000 11.7 -0.7619835839190333
Create the Grafana dashboard
Point your browser to http://localhost:3000 and log in to Grafana. You may change your password if you wish.
The interface of Grafana is not that user friendly so I'm going to help you a bit for your first dashboard.
Click on Add data source, and select InfluxDB:

Configure it like this:
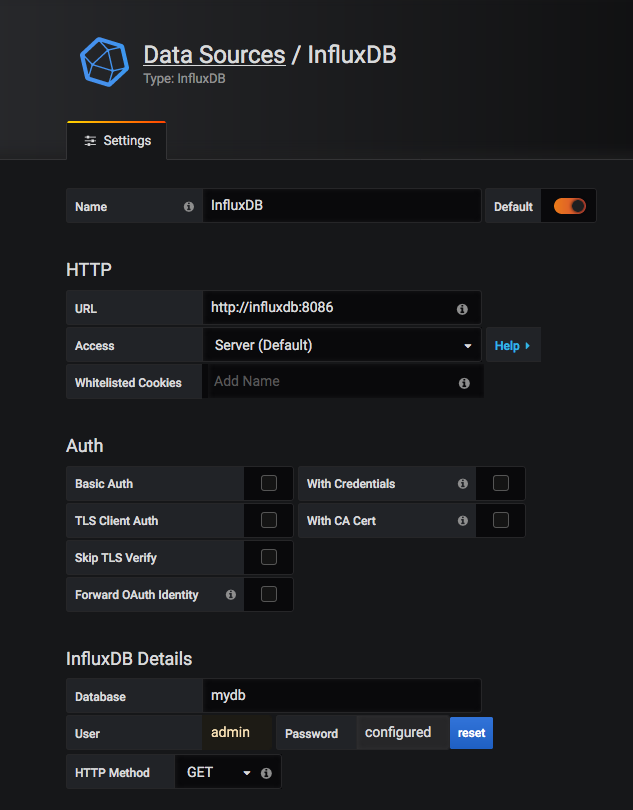
Go back, click on the dashboard icon, and on new dashboard. Then, Add query. Select the sinwave measurement, and the y field as shown below:

Go back again, and click on dashboard settings (the wheel on the top right), in auto-refresh, add 1s at the beginning of the field like like this:
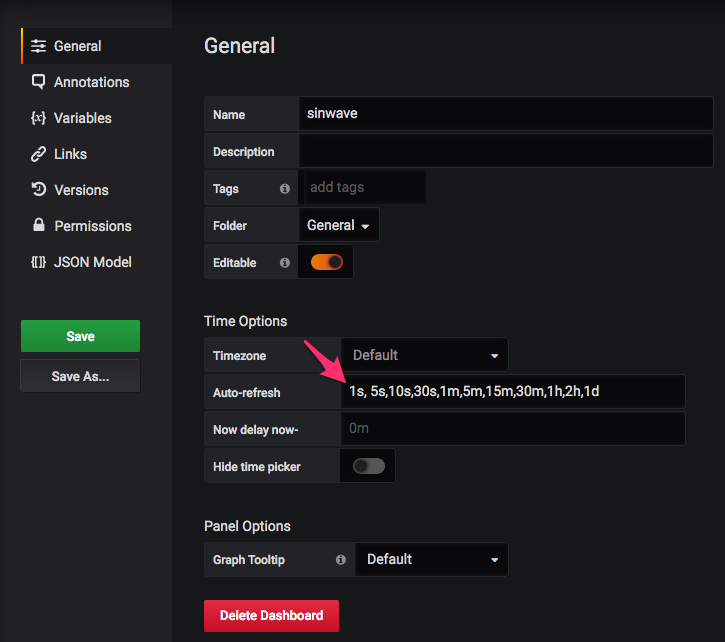
This will allow you to set the auto-refresh every 1s. Save the dashboard, and give it a name. Click on home, and select your dashboard. Then, select the refresh rate in the drop-down menu on the top right, and request to show the last 5 minutes:

You’ll see the sine wave building up as new data points are stored to influxdb. Congratulations!
If you want to turn down your stack, do:
docker-compose down
And when you bring it up again, you will see that your dashboard is still there with all of its data, thanks to our docker volumes.
To start the stack on another X86_64 computer, be it a Linux, MacOS, or Windows PC, the only things that you need to do are to:
- install docker
- install docker-compose
- get the docker-compose.yml file on this computer, and run docker-compose up
But this will only work on the X86_64 architecture. In the next section, we'll see how to port the stack to the armv7l architecture, so that it can be used on a raspberry pi 3B+ for example.
Porting the stack to the armv7l architecture
To port the stack, we need access to a computer with this architecture. In this section I will assume that you have a raspberry pi 3B+ running Raspbian Stretch.
Please note that there is currently an issue in Rasbian Buster when it comes to pushing docker images to Docker Hub or to another docker registry. So you should really use Stretch.
So log in to the pi.
First, install Docker . Choose the Debian / arm architecture. Note that there are specific instructions for Raspbian, which will drive you here .
In my case (stock Raspbian Stretch Lite), the script fails with:
E: Sub-process /usr/bin/dpkg returned an error code (1)
To fix this, just do:
sudo apt-get install docker-ce docker-ce-cli containerd.io
and reboot the pi.
Now test the docker hello-world image:
sudo docker run hello-world
Add user pi to the docker group to allow this user to run docker without sudo:
sudo usermod -aG docker pi
Log out and log back in again. You should now be able to run without sudo:
docker run hello-world
Now install docker-compose:
sudo apt install python-pip libffi-dev libssh-dev
sudo pip install docker-compose
Then, try to run the dummy sensor image we have created above on the pi:
docker run cbernet/iot_dummy_sensor:v1.0-X86_64
This fails with:
standard_init_linux.go:211: exec user process caused "exec format error"
This error typically indicates that the image you are trying to use has not been built for your architecture. It’s the case here. We created the image for the X86_64 architecture, and we are trying to use it on the armv7l architecture. So we need to build the image for the armv7l architecture.
Copy the necessary files to your pi:
- app.py
- Dockerfile
- requirements.txt
Then build the image on the pi:
docker build -t sensor .
And try to run it:
docker run sensor
Now it runs, even though the script is not able to find the influxdb server, of course.
Edit the docker-compose.yml file, replacing the X86_64 image on docker hub with the one we have just created:
version: "3"
services:
  influxdb:
    image: influxdb
    ports:
      - "8086:8086"
    volumes:
      - influxdb:/var/lib/influxdb
  sensor:
# use your username instead of mine below!
#    image: cbernet/iot_dummy_sensor:v1.0-X86_64
    image: sensor
    links:
      - influxdb
  dashboard:
    image: grafana/grafana
    links:
      - sensor
    ports:
      - "3000:3000"
    volumes:
      - grafana:/var/lib/grafana

volumes:
  influxdb:
  grafana:
And bring up the stack:
docker-compose up
Your stack should now be running on the raspberry pi. Let’s upload the arm image to Docker Hub:
docker tag sensor cbernet/iot_dummy_sensor:v1.0-armv7l
docker login
docker push cbernet/iot_dummy_sensor:v1.0-armv7l
You should now see the new tag on Docker Hub:

So now, users can find out about their architecture, and select the correct tag to run the dummy sensor on their machine.
But this is not that easy: some people don’t know what’s an architecture, and the tag names we have chosen might not be obvious to everybody. Moreover, the docker-compose.yml file needs to be edited to pick up the correct image depending on the machine where we want to run the stack.
In the next section, we will see how to make the life of our users even easier.
Creating a multi-architecture docker image (manifest)
For that, we need to activate the experimental docker engine features. This sounds scary, but it’s not. This is going to be easy, and most people actually use these features.
First, check your docker version:
docker version
Client: Docker Engine - Community
Version:           19.03.1
API version:       1.40
Go version:        go1.12.5
Git commit:        74b1e89
Built:             Thu Jul 25 21:32:16 2019
OS/Arch:           linux/arm
Experimental:      false

Server: Docker Engine - Community
Engine:
  Version:          19.03.1
  API version:      1.40 (minimum version 1.12)
  Go version:       go1.12.5
  Git commit:       74b1e89
  Built:            Thu Jul 25 21:26:16 2019
  OS/Arch:          linux/arm
  Experimental:     false
containerd:
  Version:          1.2.6
  GitCommit:        894b81a4b802e4eb2a91d1ce216b8817763c29fb
runc:
  Version:          1.0.0-rc8
  GitCommit:        425e105d5a03fabd737a126ad93d62a9eeede87f
docker-init:
  Version:          0.18.0
  GitCommit:        fec3683
We see that the experimental features are set to false (off) for both the client and the server. On the pi, you can do that by adding the following configuration fragment in ~/.docker/config.json for the client:
{
  "experimental": "enabled"
}
And this one in /etc/docker/daemon.json for the server (create this file if necessary):
{
  "experimental": "true"
}
Restart the docker server and check the docker version again:
sudo systemctl daemon-reload
sudo systemctl restart docker
docker version
Make sure the experimental features are now set to true for both the client and the server.
Now we can use the docker manifest command. Try it on the influxdb image:
docker manifest inspect influxdb
{
   "schemaVersion": 2,
   "mediaType": "application/vnd.docker.distribution.manifest.list.v2+json",
   "manifests": [
      {
         "mediaType": "application/vnd.docker.distribution.manifest.v2+json",
         "size": 1994,
         "digest": "sha256:ff74d8b967fde4a45372e387bca6cb87c84338ec1ec09b0e83cf40240f967cc0",
         "platform": {
            "architecture": "amd64",
            "os": "linux"
         }
      },
      {
         "mediaType": "application/vnd.docker.distribution.manifest.v2+json",
         "size": 1993,
         "digest": "sha256:28f905735aa8f9404f738e5b7fbcf0dd6b6adcb3d6d4189d412013157c9bafd5",
         "platform": {
            "architecture": "arm",
            "os": "linux",
            "variant": "v7"
         }
      },
      {
         "mediaType": "application/vnd.docker.distribution.manifest.v2+json",
         "size": 1993,
         "digest": "sha256:fa6368915231f23733f91b763e82e054b1ef63cd1ff4e6adf478d23610feee5d",
         "platform": {
            "architecture": "arm64",
            "os": "linux",
            "variant": "v8"
         }
      }
   ]
}
We see that there are three manifests for this image, corresponding to amd64, arm, and arm64. Actually, amd64 corresponds to the X86_64 architecture, and arm to armv7l.
We need to create an image of our dummy sensor with a manifest for amd64 and arm. This is very easy:
docker manifest create cbernet/iot_dummy_sensor:latest cbernet/iot_dummy_sensor:v1.0-X86_64 cbernet/iot_dummy_sensor:v1.0-armv7l
Check the manifest:
docker manifest inspect cbernet/iot_dummy_sensor:latest
{
   "schemaVersion": 2,
   "mediaType": "application/vnd.docker.distribution.manifest.list.v2+json",
   "manifests": [
      {
         "mediaType": "application/vnd.docker.distribution.manifest.v2+json",
         "size": 1996,
         "digest": "sha256:3e862aad53f8030dd452139175afe3f1a6ed07aaf0d7636e081eea05166f4838",
         "platform": {
            "architecture": "amd64",
            "os": "linux"
         }
      },
      {
         "mediaType": "application/vnd.docker.distribution.manifest.v2+json",
         "size": 1996,
         "digest": "sha256:e951502cff88ba8913bad184921865b49d655f33e9be39765608997c27614be8",
         "platform": {
            "architecture": "arm",
            "os": "linux"
         }
      }
   ]
}
And push to Docker Hub:
docker manifest push cbernet/iot_dummy_sensor:latest
You can now udpate the docker-compose.yml file to use the multi-architecture image:
...
  sensor:
    image: cbernet/iot_dummy_sensor
...
And you're now good to go! The stack will work right away on any machine based on the X86_64 or armv7l architecture.
Conclusion
In this article, we have seen how to setup a data pipeline, from data collection to visualization, with modern tools:
- Docker makes it extremely easy to deploy a stack of services on a variety of machine. Maybe you found it a bit difficult for the first time, but the more you'll use it, the more natural it will be for you.
- InfluxDB is an excellent solution for storing time-series, and is perfectly adapted to IOT and experimental data.
- Grafana lets you define your dashboard from your web browser, and is actually a very light tool
So now, you just need to create an image for your own sensor, whatever it can be! And the rest of the stack can stay as it is.
Soon, I'll show you how I designed a stack to monitor the power consumption of my house in real time :

Read more
about the raspberry pi
- Fast Minimal Install of a Raspberry Pi : Standard installation of raspbian Lite, to get only what you need.
- Raspberry pi Zero W : Headless Install : Headless installation of Raspbian Lite, without screen and without keyboard.
about databases
- MongoDB in 10′ : Fill with python, Read with pandas : MongoDB is a cool NoSQL database that can make your life easier. Set up your server, fill it with python, and process the data with pandas
- MongoDB : Remote Access (raspberry pi) : remote access to a MongoDB server, with a simple introduction to firewall management.
about visualisation
- Interactive Visualization with Bokeh in a Jupyter Notebook : Matplotlib is not for interactive display. Try bokeh!
- Show your Data in a Google Map with Python : study real-estate price in France near Geneva on a Google Map, with pandas and bokeh.
- Choropleth Maps in Python : Learn how to do choropleth maps (colored maps with political or physical boundaries) avec geoviews et geopandas.
Please let me know what you think in the comments! I’ll try and answer all questions.
And if you liked this article, you can subscribe to my mailing list to be notified of new posts (no more than one mail per week I promise.)
Learn about Data Science and Machine Learning!
You can join my mailing list for new posts and exclusive content: